The Metrics Mess: Why the Lack of Clear and Common KPIs is Undermining SecOps (and How We Can Fix It)
Eric Olson (JetBlue Airways)
BSides NYC 2023 (0x04) · Day 1 · Talk - Blue
Overview
Eric Olson, a self-described "NBA bean counter weenie" who accidentally found his way into cybersecurity in 1999, delivered a compelling talk at BSides NYC addressing a fundamental flaw in the security industry: the absence of clear, common Key Performance Indicators (KPIs) for Security Operations (SecOps). Olson, whose remit at JetBlue Airways spans threat intelligence, threat hunting, SOC, incident response, attack simulation, and detection engineering, argues that this "metrics mess" is a significant impediment to effective security. Without standardized definitions and a shared language for measuring incident response, organizations are unable to accurately assess their performance, identify bottlenecks, or demonstrate improvement.
Key moments
- 0:00 Speaker's unique background and role at JetBlue
- 2:50 Miter ATT&CK: A common language for security
- 5:30 The 'Metrics Mess': Inconsistent definitions for SOC KPIs
- 7:00 Vendor data analysis reveals poor KPI definitions
- 8:30 Exposing the circular definition of 'Mean Time to Respond'
The Metrics Mess: Why the Lack of Clear and Common KPIs is Undermining SecOps (and How We Can Fix It)
Speakers: Eric Olson, JetBlue Airways
Conference: BSides NYC
YouTube: https://www.youtube.com/watch?v=SmcKzH5sid8
Overview
Eric Olson, a self-described "NBA bean counter weenie" who accidentally found his way into cybersecurity in 1999, delivered a compelling talk at BSides NYC addressing a fundamental flaw in the security industry: the absence of clear, common Key Performance Indicators (KPIs) for Security Operations (SecOps). Olson, whose remit at JetBlue Airways spans threat intelligence, threat hunting, SOC, incident response, attack simulation, and detection engineering, argues that this "metrics mess" is a significant impediment to effective security. Without standardized definitions and a shared language for measuring incident response, organizations are unable to accurately assess their performance, identify bottlenecks, or demonstrate improvement.
This talk makes a critical case for establishing a universally accepted framework for SecOps metrics, akin to how MITRE ATT&CK revolutionized the understanding of Tactics, Techniques, and Procedures (TTPs). Olson highlights that the current ambiguity in defining terms like Mean Time To Detect (MTTD) and Mean Time To Respond (MTTR) prevents meaningful analysis and undermines the ability of security teams to improve their posture and communicate value to the business. His proposed "B6 Timeline Model" offers a practical starting point for the industry to collaboratively define and standardize these crucial metrics, ultimately enabling organizations to reduce dwell time and, consequently, damage from cyber incidents.
Background
▶ Watch: Speaker's unique background and role at JetBlue (0:00)
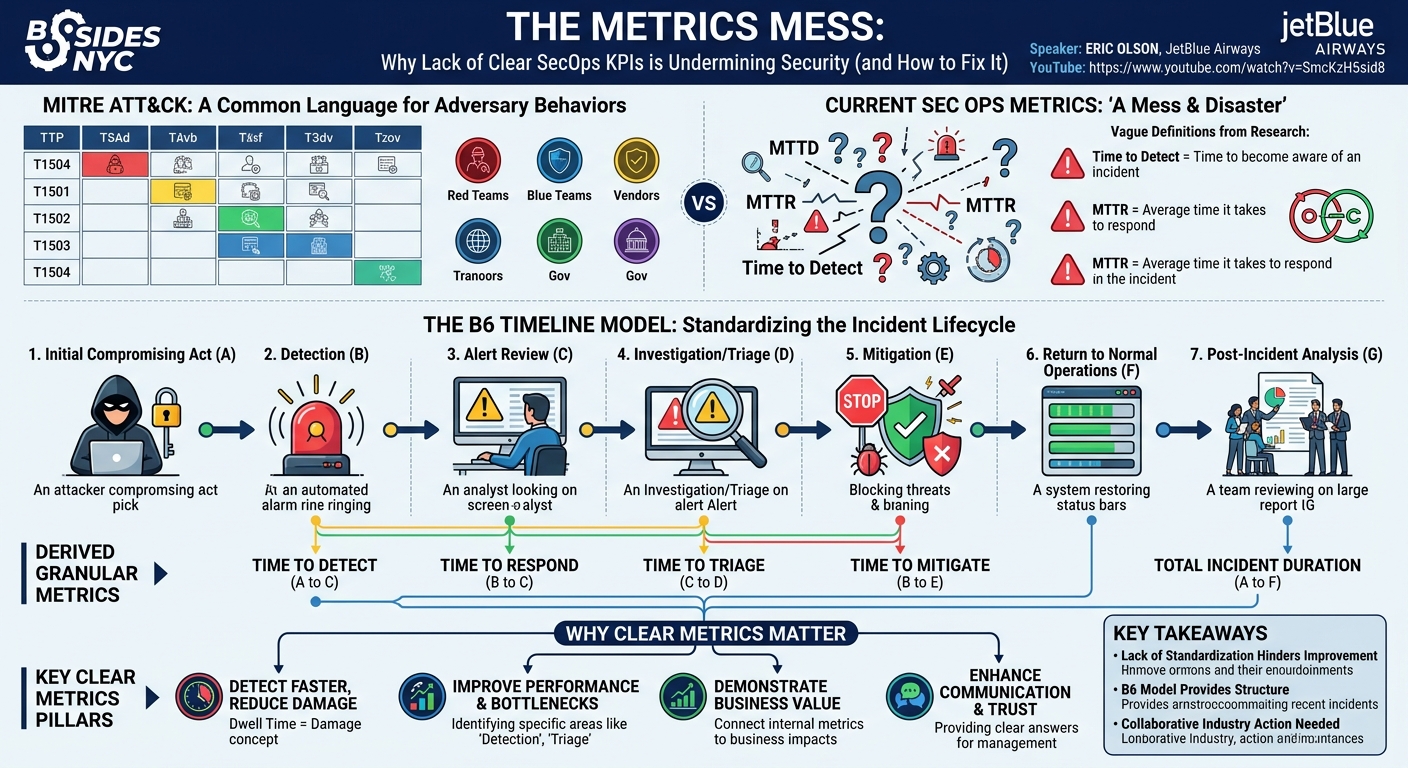
The foundation of Olson's argument rests on a stark contrast: while the security industry has successfully established a common lexicon for attacker behaviors through MITRE ATT&CK, it utterly fails to do so for the metrics used to measure defensive operations. He praises MITRE ATT&CK as a "Rosetta Stone" that provides a "lingua franca" for red teamers, blue teamers, vendors, and government officials, allowing everyone to agree on what "T1504-b sub c number two" means. This shared understanding is critical for discussing attack chains, developing detections, and sharing threat intelligence.
However, Olson's extensive research into SecOps metrics reveals a "mess" and a "disaster" when it comes to measuring the effectiveness of security teams. Driven by his background as a "spreadsheet guy," he undertook an analysis of 30 sources on SecOps KPIs and key SecOps metrics. He was forced to discard 18 of these sources due to their unusable data, narrowing his focus to 12 formal publications—white papers or blog posts—from security vendors who had collectively raised $2.5 billion in funding. This selection represented the "top of the pile," yet their definitions for critical metrics were shockingly inadequate.
Olson provided several egregious examples from his research:
- One vendor defined Mean Time To Respond as "the average time it takes to respond," a classic circular reference problem that provides no functional clarity.
- Another defined Time to Detect as "the time it takes to become aware of an incident." Olson questioned what "become aware" and "incident" actually mean in this context, highlighting the ambiguity.
- A company that had raised $30 million defined "the time to become aware of Indicators of Compromise (IoCs) and other threats." Olson pointed out the lack of start and stop points for the clock.
- Mimecast, with $90 million in funding, defined Time to Detect as "the time to identify an attack," again without specifying if this starts with an alert, a human reading it, or a human validating it.
- Cipher simply listed "time to time to" without any explanation.
- Olson's "personal favorite" came from Security Scorecard, which defined "the time it takes your security team and technology to notice abnormal behavior." He humorously noted the subjectivity of "noticing abnormal behavior" and the logical fallacy of combining technology detection and human observation into a single metric.
Beyond vague definitions, Olson's data revealed a startling lack of consensus on even the most basic metrics. Of the 12 "credible" sources, only nine included "time to detect" in their list of important SOC metrics. This means a quarter of the industry's supposed thought leaders don't consider time to detect a crucial measure for a SOC whose primary job is to "sit there, stare at things, and when they go ding, notice them." Only LogRhythm, with their CTO authoring the piece, managed to provide "vaguely right" definitions, underscoring the severity of the problem across the industry. This fundamental lack of a common language for metrics, Olson argues, is why SecOps struggles to measure performance, identify areas for improvement, and ultimately keep businesses safe.
Key Findings
▶ Watch: Miter ATT&CK: A common language for security (2:50)
The central finding of Olson's talk is that the lack of a common language and agreed-upon definitions for SecOps metrics is a critical, pervasive issue undermining the entire security industry. This ambiguity isn't just an academic problem; it has profound practical implications for security teams and the businesses they protect.
Firstly, the inability to consistently define and measure metrics like MTTD and MTTR prevents organizations from accurately assessing their performance. When "time to detect" can mean anything from the moment an attacker gains Initial Access to when an analyst finally validates an alert, comparison across teams, tools, or even within the same organization over time becomes impossible. This leads to what Olson describes as "monthly gymnastics with a spreadsheet" for practitioners trying to reconcile disparate data from their Security Information and Event Management (SIEM), Security Orchestration, Automation, and Response (SOAR), and ticketing systems, which often operate with different definitions and time zones.
Secondly, and more fundamentally, this metric mess directly hinders improvement. Olson invokes Peter Drucker's famous adage, "You can't manage what you can't measure," correcting it to the more precise, "If you can't measure it, you can't improve it." Without granular, well-defined metrics, security teams cannot pinpoint specific bottlenecks in their incident response process. If a total incident duration is 100 hours, but the team doesn't know if 98 of those hours were spent on initial detection, triage, or mitigation, they cannot effectively target their efforts for improvement.
Olson frames the ultimate purpose of cybersecurity professionals into four core reasons:
- Reduce the likelihood of a loss event (preventative controls).
- Detect faster to reduce the likelihood of damage from that event (detective and response controls).
- Ensure compliance (regulatory fines).
- Defend the brand (reputational damage).
His talk specifically focuses on the second point: "detect faster." The critical insight here is that dwell time equals damage. The longer an adversary remains undetected and uncontained within a network, the greater the potential for data exfiltration, system compromise, or financial loss. Therefore, any effort to shorten the incident lifecycle directly translates to reduced business impact.
Finally, Olson highlights a crucial disconnect between SecOps practitioners and executive leadership. While security teams struggle with granular, ill-defined metrics, management, represented by a CEO, primarily cares about two things: "How long ago did they get in?" and "How fast did you fix it?" These translate to the Exposure Window (initial compromise to mitigation) and Total Incident Duration (initial compromise to return to normal operations). The current state of SecOps metrics makes it incredibly difficult to provide these high-level, business-critical answers with confidence, further undermining the perceived value and effectiveness of security investments.
Technical Deep Dive
▶ Watch: The 'Metrics Mess': Inconsistent definitions for SOC KPIs (5:30)
To address the pervasive ambiguity in SecOps metrics, Eric Olson, in collaboration with engineer Andrew Malone, proposes the B6 Timeline Model. Named after JetBlue's airline code, this model aims to provide a standardized, sequential framework for understanding and measuring the lifecycle of a cyber incident, from the moment of compromise to the full resolution. The model breaks down an incident into distinct, measurable phases, enabling granular analysis and clear definition of KPIs.
The B6 Timeline Model outlines the following key phases of an incident:
- Initial Compromising Act (A): The very beginning of the incident, when an adversary first gains unauthorized access or executes malicious code. Olson stresses that this is where the clock should start for many critical metrics.
- Detection (B): The point at which a security control (e.g., EDR, SIEM) triggers an alert or "goes ding." Olson notes that the time between A and B can range from milliseconds to months, depending on the attacker's sophistication and the control's efficacy.
- Alert Review (C): The moment a human analyst picks up the alert from a queue, pager, or console. This marks the transition from automated detection to human involvement.
- Investigation/Triage (D): The period during which the analyst investigates the alert to determine if it's a true positive, a false positive, or requires escalation to a higher-tier team (e.g., a CERT team).
- Mitigation (E): Actions taken to stop the immediate threat and contain the damage, such as isolating a compromised machine, blocking malicious IPs, or disabling accounts. This is about "stopping the bleeding."
- Return to Normal Operations (F): The point at which the affected systems or services are restored to a functional, secure state. Olson clarifies that this often represents a "new normal" rather than a complete return to pre-event conditions.
- Post-Incident Analysis/Reporting (G): The final phase, involving comprehensive analysis, root cause identification, and detailed reporting (e.g., a 50-page Mandiant report).
Based on this granular timeline, Olson proposes specific, clearly defined metrics that can be derived from these universally agreed-upon points:
- Time to Detect (A to C): The time from the Initial Compromising Act to when the human analyst looks at the alert. Olson argues this is crucial because if a control "dings" but no human sees it, the detection is effectively infinite. This metric is an aggregate of the control's detection time (A to B) and the human's response time to the alert (B to C).
- Time to Respond (B to C): Specifically, the time from when the alert "goes ding" to when the analyst looks at the alert. This isolates the human response efficiency to a triggered control.
- Time to Mitigate (B to E): The duration from the alert "going ding" to when the "bleeding is stopped" through containment actions.
- Time to Triage (C to D): The time from the analyst reviewing the alert to deciding whether it's a legitimate incident requiring further action or escalation.
- Time to Resolve (C to F): The total time from the analyst reviewing the alert to the return to normal operations.
- Exposure Window (A to E): The total time from the Initial Compromising Act to when the bad actor's activities are mitigated and they are "kicked to the curb." Olson emphasizes that this is the metric management cares about most.
- Total Incident Duration (A to F): The entire duration from the Initial Compromising Act to the return to normal operations. This is the second most critical metric for executive leadership.
The power of the B6 Timeline Model lies in its ability to disaggregate the overall incident lifecycle into distinct, measurable components. This allows security teams to identify precisely which part of their process is inefficient. For example, if the Total Incident Duration is high, the model helps determine if the delay is in automated detection (A to B), human response to alerts (B to C), investigation (C to D), or mitigation efforts (D to E). By understanding these specific bottlenecks, teams can implement targeted improvements, whether it's tuning SIEM rules, improving SOAR playbooks, training analysts, or enhancing automation.
Olson challenges the industry to adopt such a model, not necessarily his exact definitions, but the principle of establishing a common, granular, and actionable framework for SecOps metrics. This systemic approach is vital for transforming security operations from a "babbling at each other" scenario to a truly measurable and improvable function.
Demo / Proof of Concept
▶ Watch: Vendor data analysis reveals poor KPI definitions (7:00)
While Eric Olson's talk is primarily a conceptual and philosophical discussion rather than a demonstration of a software tool or a live hack, it contained several elements that served as a "proof of concept" for the problem at hand and a conceptual "demo" of his proposed solution.
The initial "Icebreaker" interaction with the audience served as a live, albeit informal, proof of concept for the "metrics mess." When Olson asked experienced SOC professionals to define MTTR, he received conflicting answers: "mean time to respond" versus "mean time to resolution." This immediate, real-world example from the audience perfectly underscored his central premise that even basic, commonly used SecOps metrics lack a consistent, agreed-upon definition. This spontaneous demonstration highlighted the industry's confusion and the urgent need for standardization.
The "demo" of Olson's solution, the B6 Timeline Model, was presented through a series of slides illustrating the sequential phases of an incident from Initial Compromising Act through Return to Normal Operations. He visually walked the audience through how different traditional metrics (like MTTD and MTTR) could ambiguously map to various points on this timeline, and then showed how his proposed metrics (e.g., Time to Detect as A to C, Time to Respond as B to C) provide precise, unambiguous start and stop points. This visual breakdown served as a conceptual blueprint for how organizations could define and measure their SecOps performance more effectively.
Furthermore, while no live tools were demonstrated, Olson implicitly referenced the practical application of his model in a real-world SecOps environment. He discussed how, at JetBlue, they use attack simulation tools (mentioning AttackIQ and Red Canary, alongside open-source alternatives) to validate controls. After drafting detections and playbooks, they "go attack us with that" to measure actual performance against the defined timeline. This allows them to gauge "how fast did it go ding," "how soon did the analysts... notice the thing," and "how long before they decided it was a thing." This integration of validation with a structured timeline serves as the operational proof of concept for the B6 model's utility in continuous improvement. The talk itself, therefore, was a compelling articulation of a problem and a conceptual framework for its solution, underpinned by real-world operational insights.
Defensive Implications
▶ Watch: Exposing the circular definition of 'Mean Time to Respond' (8:30)
The implications of Eric Olson's arguments and his proposed B6 Timeline Model for defensive security teams are profound and actionable. Addressing the "metrics mess" is not merely an academic exercise; it's fundamental to improving security posture and communicating value.
- Standardize Metric Definitions Internally and Externally: Defenders must advocate for and adopt clear, unambiguous definitions for their SecOps KPIs. Organizations should begin by implementing a standardized timeline model, such as the B6 model, within their own teams. This internal consistency is the first step towards accurate measurement. Beyond internal efforts, practitioners should actively engage in community discussions, blogs, and working groups to drive industry-wide consensus, similar to how MITRE ATT&CK gained widespread acceptance.
- Demand Clarity and Alignment from Vendors: Olson explicitly calls for "slapping your vendors around." Security teams should demand that their SIEM, SOAR, EDR, and ticketing system providers align their metric reporting with clear, standardized definitions. This includes ensuring consistency in timestamps (e.g., local vs. GMT) and the precise start and end points for metrics like MTTD and MTTR. Vendors who fail to provide transparent, functionally usable metric definitions should be challenged, as their tools are integral to accurate performance measurement.
- Focus on Granular Measurement for Improvement: The B6 model highlights the importance of breaking down the overall Total Incident Duration into its component parts. Instead of just reporting a single, aggregated time, SecOps teams should measure each phase: Time to Detect (compromise to human review), Time to Respond (alert to human review), Time to Triage (review to decision), and Time to Mitigate (alert to containment). This granular visibility allows managers to pinpoint specific bottlenecks – whether it's an inefficient control, a slow human response, or a cumbersome investigation process – and apply targeted improvements.
- Translate Internal Metrics into Business Value: While granular metrics are vital for internal process improvement, defenders must also be able to communicate effectively with executive leadership. This means being able to confidently report on the Exposure Window (compromise to mitigation) and Total Incident Duration (compromise to return to normal). By connecting the dots between internal SecOps performance and these high-level business impacts, security teams can better justify resources, demonstrate value, and ensure leadership understands the consequences of prolonged dwell time.
- Integrate Continuous Validation and Measurement: Olson emphasizes that "an untested control, an unvalidated control is not a control, it's a hope." Defensive teams should actively integrate attack simulation platforms (like AttackIQ, Red Canary, or open-source alternatives) into their daily operations. These tools allow teams to proactively test their preventative and detective controls against current TTPs, measuring the actual time it takes for controls to "ding" and for the SOC to respond. This continuous validation loop ensures that reported metrics reflect real-world performance and drives continuous improvement in detection engineering and response playbooks.
- Recognize the Role of Preventative Controls: While Olson's talk focuses on detection and response, he acknowledges that ideally, his job wouldn't be as critical if preventative controls were perfectly effective. Defenders should strive for robust preventative measures, such as application safelisting and strict account management, to reduce the likelihood of the Initial Compromising Act in the first place. This holistic view ensures that efforts are not solely focused on reaction but also on proactive risk reduction.
By embracing a standardized, granular, and business-aligned approach to metrics, defensive teams can move beyond the "babbling" phase, gain clearer insights into their operational effectiveness, drive continuous improvement, and build greater trust with their organizational stakeholders.
Key Takeaways
- The cybersecurity industry currently lacks a standardized, clear, and actionable framework for SecOps metrics, leading to widespread ambiguity and hindering effective measurement and improvement, unlike the common language provided by MITRE ATT&CK for TTPs.
- Existing definitions for critical Key Performance Indicators (KPIs) like Mean Time To Detect (MTTD) and Mean Time To Respond (MTTR) from leading vendors are often vague, circular, or inconsistent, making it impossible for organizations to accurately assess or compare their security performance.
- Eric Olson's proposed B6 Timeline Model offers a structured, sequential framework for incident stages (from Initial Compromising Act to Return to Normal Operations), enabling the derivation of precise, granular metrics for each phase of an incident.
- Granular metrics derived from the B6 model, such as Time to Respond (alert to human review) and Time to Triage (review to decision), are crucial for identifying specific bottlenecks and inefficiencies within the SecOps process, allowing for targeted improvements.
- Executive leadership primarily focuses on high-level metrics like Exposure Window (compromise to mitigation) and Total Incident Duration (compromise to resolution); SecOps teams must translate their internal performance into these business-relevant terms to demonstrate value and justify security investments.
- The industry, encompassing practitioners, vendors, and academics, must collaboratively establish a consensus on SecOps metric definitions to enable true measurability, manageability, and continuous improvement, thereby reducing dwell time and damage from cyber incidents.
About the Speaker(s)
Eric Olson, currently with JetBlue Airways, brings a unique perspective to the cybersecurity landscape. He openly admits he is "not actually a security person" by traditional training. Instead, he describes himself as an "NBA bean counter weenie" who accidentally stumbled into the cyber field in 1999 and has been "faking it kinda sorta" ever since. His background in finance and business analytics profoundly influences his data-driven approach to security challenges.
At JetBlue, Olson's extensive remit covers a broad spectrum of post-preventative security functions, including threat intelligence, threat hunting, SOC, incident response, attack simulation, and detection engineering. This hands-on experience in managing and measuring complex security operations informs his critical view on the current state of SecOps metrics. He is also a co-creator of the proposed B6 Timeline Model, developed with engineer Andrew Malone, reflecting his commitment to solving the industry's measurement challenges. Olson is known for his direct communication style, occasionally slipping into profanity, and his passionate advocacy for clarity and standardization in security.
Reviews
Dr. Zero (Offensive Security Researcher) — SOLID
Olson identifies a real and underappreciated problem — the industry genuinely can't agree on what MTTD and MTTR mean, and that's embarrassing — and he backs it up with actual primary research across 12 vendor sources. The B6 model is sensible and practitioner-friendly, but it's not novel enough to be a conference-defining moment; this is a well-argued blog post with a stage.
Heather Calloway (CISO) — SOLID
Olson correctly diagnoses a real operational problem — metric ambiguity in SecOps — and his B6 Timeline Model is a practical, usable contribution. But the talk stays inside the operator layer and never climbs to where the problem actually bites hardest: governance accountability, board reporting credibility, and the regulatory exposure that comes from not being able to demonstrate measurable program performance.