State of EPSS and What to Expect from Version 4
CVE/FIRST VulnCon 2025 · Main Stage
Overview
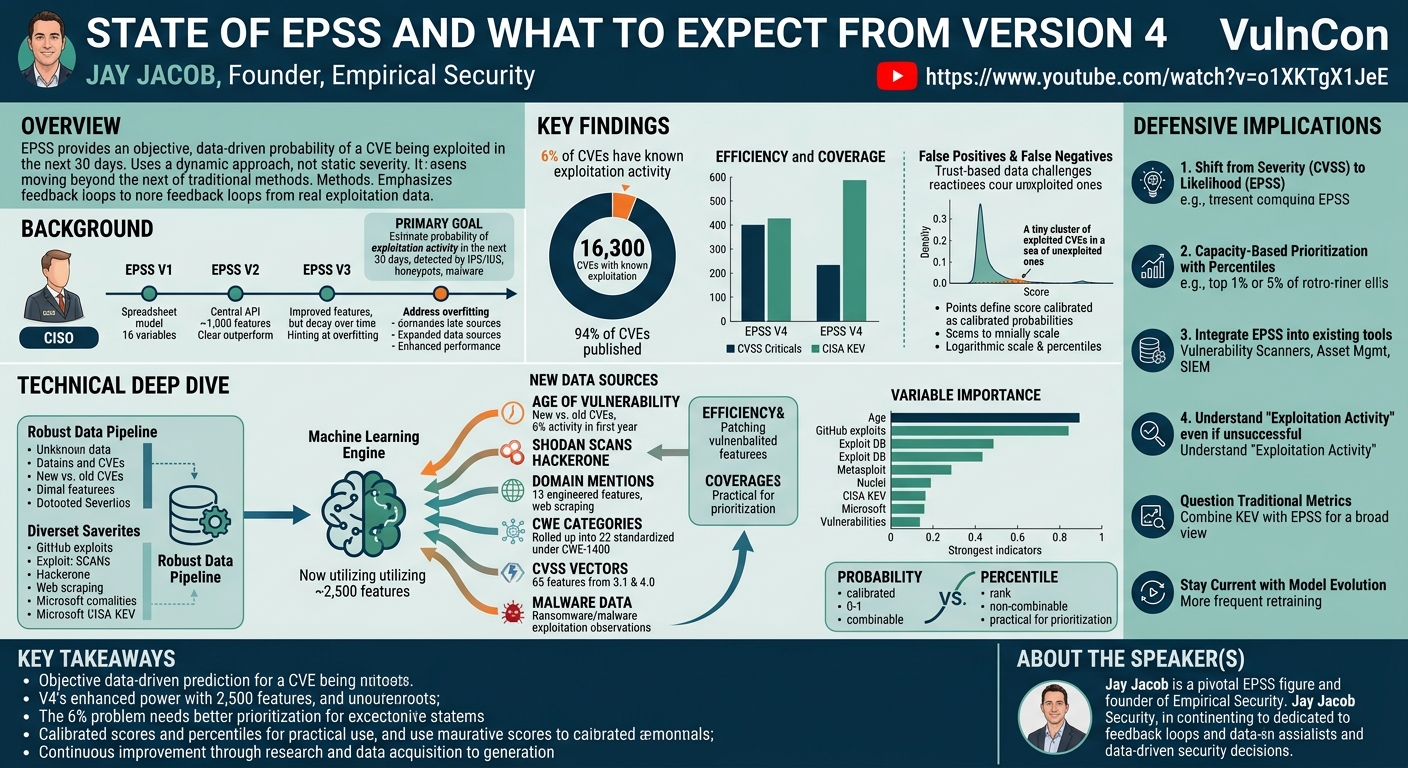
In this comprehensive talk at VulnCon, Jay Jacob, a pivotal figure in the development of the Exploit Prediction Scoring System (EPSS) and founder of Empirical Security, delved into the current state of EPSS and offered a detailed look at its latest iteration, EPSS Version 4 (V4). The presentation highlighted the critical need for a data-driven approach to vulnerability prioritization, moving beyond traditional, often subjective, methods. Jacob emphasized that EPSS is built on a fundamental principle: objective feedback from observed exploitation activity, rather than speculative risk assessments or static severity scores.
Key moments
- 0:00 Speaker's story: The critical need for feedback loops
- 2:00 EPSS fundamentals: Objective, dynamic, measurable predictions
- 3:19 EPSSV4 release and understanding the output format
- 4:00 What EPSS predicts: Probability of exploitation in 30 days
- 5:11 Key metrics: Efficiency and coverage explained
- 5:50 Demonstrating CVSS inefficiency with real exploitation data
State of EPSS and What to Expect from Version 4
Speakers: Jay Jacob, Founder, Empirical Security
Conference: VulnCon
YouTube: https://www.youtube.com/watch?v=o1XKTgX1JeE
Overview
In this comprehensive talk at VulnCon, Jay Jacob, a pivotal figure in the development of the Exploit Prediction Scoring System (EPSS) and founder of Empirical Security, delved into the current state of EPSS and offered a detailed look at its latest iteration, EPSS Version 4 (V4). The presentation highlighted the critical need for a data-driven approach to vulnerability prioritization, moving beyond traditional, often subjective, methods. Jacob emphasized that EPSS is built on a fundamental principle: objective feedback from observed exploitation activity, rather than speculative risk assessments or static severity scores.
The core problem EPSS aims to solve is the overwhelming volume of published vulnerabilities compared to the limited resources available for remediation. With hundreds of thousands of CVEs disclosed annually, organizations struggle to identify which vulnerabilities truly pose an immediate threat of exploitation. EPSS addresses this by providing a probability score that estimates the likelihood of a CVE being exploited in the next 30 days, enabling security teams to focus their efforts where they matter most.
The talk not only unveiled the technical advancements and new data sources integrated into EPSS V4 but also provided crucial insights into how the model is measured, its performance against prior versions and other industry metrics like CVSS and the CISA Known Exploited Vulnerabilities (KEV) catalog, and its practical implications for defenders. Jacob's presentation served as a call to action for the security community to embrace dynamic, data-centric models for vulnerability management, ensuring that remediation efforts are both efficient and effective in combating active threats.
Background
▶ Watch: Speaker's story: The critical need for feedback loops (0:00)
Jay Jacob began his talk with a reflective anecdote from 2009-2010, recalling a contentious debate within a large enterprise about disabling USB thumb drives due to malware concerns. Despite the significant operational impact on 4,000 IT personnel, the decision was made to disable them. Months later, when Jacob inquired about the effectiveness of this measure—specifically, whether malware incidents had decreased or user complaints had risen—the CISO admitted, "Oh, I don't know. We didn't look." This lack of a feedback loop profoundly influenced Jacob's perspective, solidifying his belief in the necessity of empirical data to inform security decisions.
This foundational principle – that actions must be measured against objective feedback – is central to EPSS. Unlike many traditional risk frameworks that rely on subjective assessments or predefined taxonomies, EPSS is built entirely on observed exploitation activity. This means it analyzes real-world evidence of attackers attempting to exploit vulnerabilities, recorded with timestamps, to produce a dynamic, predictive score. The model updates daily, incorporating new information to reflect the constantly changing threat landscape. Jacob stressed that EPSS is not "invented"; it simply takes observed exploitation data and generates a predictive probability.
The primary goal of EPSS is to estimate the probability of exploitation activity being observed in the next 30 days. It's crucial to understand that this refers to activity, not necessarily successful exploitation. This activity is typically detected by security devices such as Intrusion Prevention Systems (IPS), Intrusion Detection Systems (IDS), honeypots, or through malware detections and malware analysis. The 30-day window, while largely arbitrary, was chosen after analysis showed that extending or shortening this period primarily scaled the probability without altering the overall order of vulnerability importance.
To measure the accuracy and utility of EPSS, Jacob introduced the concepts of efficiency and coverage, which are analogous to precision and recall but framed in terms of vulnerability management. Efficiency quantifies how much of a remediation effort (e.g., patching all CVSS criticals) actually addresses exploited vulnerabilities. Coverage measures how much of the actually exploited vulnerabilities are addressed by that effort. Jacob starkly illustrated the limitations of CVSS using these metrics: prioritizing all CVSS 9 and above vulnerabilities, while seemingly robust, often yields low efficiency (meaning many patched vulnerabilities are never exploited) and moderate coverage (missing many exploited vulnerabilities below the critical threshold). This demonstrated the critical need for a more accurate, predictive model like EPSS to guide remediation strategies.
The evolution of EPSS itself underscores a journey of continuous improvement:
- EPSS V1: Introduced with 16 variables, it was designed for spreadsheet use, requiring users to collect their own data.
- EPSS V2 (2022): Marked a significant shift to a centralized model with an API, incorporating around 1,000 features. This version clearly outperformed CVSS and individual metrics.
- EPSS V3 (2023): Further improved features, showing substantial "lift" in performance. However, Jacob noted a decay in its predictive power over its two-year operational period, suggesting potential overfitting and the need for more frequent retraining.
- EPSS V4 (March 17th, 2024): The latest release, focusing on addressing overfitting, expanding data sources, and enhancing overall performance.
Key Findings
▶ Watch: EPSSV4 release and understanding the output format (3:19)
EPSS, particularly its latest iteration, consistently demonstrates superior performance in predicting actual exploitation compared to traditional vulnerability scoring systems. A central finding is that EPSS significantly outperforms CVSS and even individual threat intelligence feeds (like the CISA KEV or Metasploit) in terms of both efficiency and coverage. While CVSS was not designed for exploitation prediction, many organizations rely on it for prioritization, often leading to inefficient resource allocation. EPSS, by contrast, is purpose-built to identify which vulnerabilities are most likely to be exploited, allowing defenders to focus their efforts on actual threats.
A critical observation from the EPSS data is the stark reality of exploitation prevalence: only about 6% of all published CVEs have known exploitation activity. This means a staggering 94% of vulnerabilities, despite being published, are not actively exploited in the wild. However, this 6% still represents a significant number—16,300 published vulnerabilities with known exploitation activity, which is 13 times the number currently listed on the CISA KEV. This highlights a dual problem: while most CVEs are not exploited, the volume of actually exploited CVEs is far greater than what is typically prioritized by government-curated lists alone.
Jacob candidly addressed the challenges of false positives and false negatives in the underlying exploitation data. The model, he explained, trusts its data sources (e.g., vendor reports of exploitation activity), and fact-checking every single instance is practically impossible. While efforts are made to filter out misassociations (e.g., a single IDS signature blocking multiple CVEs), the presence of some false positives is acknowledged. Simultaneously, EPSS is "absolutely missing things," indicating the ongoing challenge of comprehensive data collection. This complex reality underscores that no single data source or model is perfect, but EPSS strives to provide the most accurate predictive signal available.
The inherent difficulty of the problem EPSS tackles was visually emphasized through a density plot, where a tiny cluster of exploited vulnerabilities was shown amidst a vast sea of unexploited ones. The challenge is akin to finding a few needles in an immense haystack. This visualization effectively countered arguments that EPSS might be "wrong" if a low-scoring CVE is exploited, by stressing that such an event is statistically accounted for within the model's probabilistic framework.
Key findings regarding EPSS scores themselves include:
- Calibration: EPSS scores are calibrated probabilities. This means if the model assigns a 1% probability to a set of CVEs, approximately 1% of those CVEs are expected to be exploited. This allows for a statistically sound interpretation of the scores.
- Logarithmic Scale: While linear plots of EPSS scores might appear to show little separation between exploited and unexploited vulnerabilities at lower scores, a logarithmic scale reveals clear separation, demonstrating the model's ability to differentiate effectively.
- Percentiles for Prioritization: The EPSS percentile offers a highly practical way for organizations to prioritize. It ranks all CVEs, indicating what percentage of vulnerabilities are at or below a given score. For instance, the top 1% of EPSS-scored vulnerabilities were found to contain 96% of the exploitation activity within that range. This allows organizations to define remediation targets based on their capacity (e.g., "patch the top 5% of EPSS vulnerabilities") rather than relying on arbitrary thresholds.
Technical Deep Dive
▶ Watch: What EPSS predicts: Probability of exploitation in 30 days (4:00)
EPSS V4 represents a significant leap in the system's technical sophistication, designed as a predictive model to estimate the likelihood of exploitation activity within a 30-day window. The underlying engine has undergone a complete overhaul in its data collection, moving from Scientia to Jacob's new company, Empirical Security. This transition has resulted in a more robust data pipeline, enhanced funding, and increased staffing, enabling the acquisition of commercial data sources that were previously unavailable.
The number of features (variables) used in the model has expanded dramatically, from around 1,000 in V2/V3 to approximately 2,500 features in V4. These features are derived from a diverse array of data sources, categorized for clarity but interpreted holistically by the model:
- Age of Vulnerability: This classic feature tracks how long a CVE has been published. Generally, newer vulnerabilities tend to have a reduced probability of exploitation, though critical zero-days are exceptions. Analysis shows that about 6% of all exploitation activity targets vulnerabilities in their first year after publication, indicating that older, more established vulnerabilities are often the focus.
- New Sites and Activity Feeds:
- Shodan: Integration of data indicating if Shodan is actively scanning the internet for a particular CVE, and how many instances it identifies.
- HackerOne: Incorporates findings from bug bounty programs that identify CVEs in the wild.
- Domain Mentions: A sophisticated set of 13 engineered features derived from extensive web scraping of articles, blogs, and media posts mentioning CVEs. These features are designed to capture timing (e.g., "referenced in the last 30 days") and associations with malware or threat actors.
- CWE Categories: Previously, raw Common Weakness Enumerations (CWEs) were used, which could be confusing due to varying levels of abstraction. In V4, all CWEs are rolled up into 22 standardized categories under CWE-1400, providing a more consistent and interpretable input for the model.
- CVSS Vectors: Instead of just using the overall CVSS score, V4 incorporates 65 distinct features derived from the individual vectors of both CVSS 3.1 and 4.0. This allows the model to understand the granular impact of specific attack vectors, privileges required, user interaction, etc.
- Malware Data: A significant addition in V4 is the inclusion of malware data, specifically observations and analysis of ransomware and other malware leveraging CVEs in their exploitation activities. This provides a direct link to real-world attacker methodologies.
The model is trained on an enormous dataset comprising 82 billion CVE-plus-days, where each row represents a CVE's state of information on a given day. This data is highly sparse, meaning most features are not set for most vulnerabilities, adding to the complexity of the machine learning task. The training process aims to identify patterns in these 2,500 variables that correlate with observed exploitation activity.
Variable Importance, often visualized using concepts like SHAP (SHapley Additive exPlanations) values, reveals the influence of different features on the EPSS score. It's not a simple linear regression; variables interact. Key observations from V4's variable importance include:
- GitHub exploits, Exploit DB, Metasploit, Nuclei, and CISA KEV are consistently strong positive indicators of exploitation.
- Microsoft vulnerabilities also stick out as having a notable influence.
- Age and the count of references generally influence the score, with older vulnerabilities and those with more references typically seeing higher probabilities.
- The CISA KEV generally exerts a positive influence on a CVE's EPSS score. However, interestingly, Jacob noted that for a small number of CVEs, being on the KEV actually lowers their EPSS probability when considered in the context of all other variables—a testament to the model's complex, non-linear interactions.
The talk also clarified the distinction between probability and percentile:
- Probability: A ratio number (0-1), representing the direct likelihood of exploitation. It is calibrated, meaning a 0.1% score indicates that 0.1% of CVEs with that score are expected to be exploited. Probabilities can be combined mathematically (e.g., to assess the overall risk of an asset with multiple vulnerabilities). However, Jacob noted that probability can be unintuitive for many users.
- Percentile: An ordinal number, representing a CVE's rank among all published CVEs. It indicates what percentage of all CVEs have a score at or below the given one. Percentiles are not combinable but are highly practical for capacity-based prioritization.
Demo / Proof of Concept
▶ Watch: Key metrics: Efficiency and coverage explained (5:11)
The talk did not feature a live demonstration or a specific proof of concept of EPSS in action against a simulated environment. Instead, Jay Jacob focused on presenting extensive data visualizations and performance metrics from the EPSS model itself. These visualizations, particularly the efficiency and coverage plots, served as the primary evidence of EPSS's capabilities and superiority over traditional vulnerability scoring methods. The presentation of the model's training data, variable importance, and calibration plots effectively functioned as a demonstration of the system's technical underpinnings and empirical validation.
Defensive Implications
▶ Watch: Demonstrating CVSS inefficiency with real exploitation data (5:50)
The insights and advancements presented for EPSS V4 carry significant implications for how organizations approach vulnerability management and defense:
- Shift from Severity to Likelihood of Exploitation: Defenders should pivot away from solely relying on static severity scores like CVSS, which are not designed to predict exploitation. EPSS provides an objective, data-driven probability of actual exploitation, enabling a more intelligent allocation of limited remediation resources. This means prioritizing CVEs that attackers are actively targeting or are highly likely to target, rather than those merely deemed "critical" by a general risk assessment.
- Capacity-Based Prioritization with Percentiles: The EPSS percentile offers a highly practical mechanism for prioritization. Instead of chasing an unattainable goal of patching all "critical" vulnerabilities, organizations can define their remediation efforts based on their actual capacity. For example, a team might commit to patching the top 1% or 5% of EPSS-ranked vulnerabilities within their environment, knowing that this addresses a disproportionately high percentage of actual exploitation activity. This approach makes vulnerability management more realistic and achievable.
- Integrate EPSS Data into Existing Workflows: EPSS data is freely available daily via CSV dumps and is increasingly integrated into commercial vulnerability management products. Defenders should actively seek to incorporate EPSS scores into their vulnerability scanners, asset management systems (e.g., ServiceNow), and security information and event management (SIEM) platforms (e.g., Splunk). This integration allows for automated, data-informed prioritization directly within existing operational workflows.
- Understand "Exploitation Activity": It's crucial for defenders to grasp that EPSS predicts "exploitation activity," not necessarily "successful exploitation." Even unsuccessful attempts indicate attacker interest and intent, which is vital threat intelligence. Organizations should treat high EPSS scores as a strong signal that attackers are actively probing for or attempting to leverage a vulnerability, regardless of whether those attempts have yielded a breach to date. This proactive stance helps in preventing future successful attacks.
- Question Traditional Metrics and Seek Independent Validation: While lists like the CISA KEV are valuable, EPSS demonstrates that a much broader set of vulnerabilities are actively exploited. Defenders should not limit their scope to just these lists but combine them with EPSS for a more comprehensive view. Organizations should also encourage and seek out independent research and evaluation of EPSS, fostering confidence in its utility as a reliable predictive tool.
- Stay Current with Model Evolution: EPSS is a continuously improving model, with V4 incorporating new data sources like malware observations, Shodan scans, and refined CWE categorizations. Defenders should stay informed about these updates and the planned move to more frequent retraining. This ensures that their prioritization strategies are based on the most current and accurate threat intelligence available.
Key Takeaways
- EPSS provides objective, data-driven exploitation prediction: Unlike static severity scores, EPSS estimates the probability of a CVE being exploited in the next 30 days based on observed real-world activity, offering a more accurate and dynamic prioritization signal.
- EPSS V4 significantly enhances predictive power: The latest version incorporates approximately 2,500 features, including new data sources like Shodan scans, HackerOne bug bounty findings, extensive web scraping for domain mentions, refined CWE categories, granular CVSS vector analysis, and crucial malware exploitation data.
- The "6% problem" highlights prioritization challenges: Only about 6% of published CVEs have known exploitation activity, yet this represents 16,300 vulnerabilities—13 times the number on the CISA KEV—underscoring the critical need for effective prioritization to manage the vast majority of non-exploited CVEs.
- Scores are calibrated probabilities and percentiles offer practical prioritization: EPSS scores are statistically calibrated, meaning a 1% score implies 1% of such vulnerabilities are expected to be exploited. The percentile ranking provides a highly actionable method for defenders to prioritize remediation efforts based on their organizational capacity (e.g., focusing on the top 1% of EPSS scores, which contain 96% of observed exploitation in that range).
- Continuous improvement is central to EPSS: The model benefits from ongoing research, more frequent retraining (moving beyond the two-year cycle of V3), and the active search for new exploitation data sources to combat false negatives and false positives, ensuring its continued relevance and accuracy in the evolving threat landscape.
About the Speaker(s)
The speaker for this session was Jay Jacob, a prominent figure in the field of vulnerability management and the driving force behind the Exploit Prediction Scoring System (EPSS). With a background rooted in understanding the critical importance of feedback loops in security decisions, Jacob has dedicated the past five to six years to the development and refinement of EPSS. He is the founder of Empirical Security, a company he established to further robust data collection and analysis for the EPSS project, including the acquisition of commercial data to enhance the model's predictive capabilities. His work emphasizes moving security prioritization from subjective assessments to objective, data-driven probabilities, providing defenders with actionable intelligence to counter real-world threats.
Reviews
Dr. Zero (Offensive Security Researcher) — STRONG ACCEPT
Jay Jacob delivers a substantive, technically grounded walkthrough of EPSS V4 at exactly the right venue. This is the creator of the system explaining design decisions, failure modes, and architectural changes with the specificity you only get from someone who built the thing and is willing to say where it went wrong. The decay/overfitting candor about V3 alone is worth the runtime. Not a 5 because the talk is largely an update to existing work rather than a paradigm shift, and the defensive implications section drifts toward the kind of 'integrate into your workflows' advice that fills conference program guides. But for a VulnCon audience doing vulnerability management work, this is…
Heather Calloway (CISO) — STRONG ACCEPT
Jay Jacob delivers a technically rigorous and operationally grounded case for EPSS V4 as the right tool for vulnerability prioritization. The core argument — that only 6% of published CVEs see exploitation activity, that CVSS was never designed for this problem, and that a calibrated predictive model outperforms static severity scores — is not new, but V4's expanded feature set and the capacity-based percentile framing give defenders something concrete to act on. The talk stops short of full institutional relevance: it does not address how organizations should change governance around vuln management programs, what board-level reporting should reflect, or how to handle the organizational…