What Makes Bike-Sharing Work?: Insights from 43 Million Kilometers of European Cycling Data
Martin Lellep, Georg Balke, Felix Waldner
39th Chaos Communication Congress (39C3): Power Cycles · Day 3 · Saal One
Overview
Bike-sharing systems present a fascinating paradox: on one hand, images of neglected, broken, or discarded bikes are common; on the other, many cities see significant investment in and successful integration of these systems, often including electric variants. This talk, "What Makes Bike-Sharing Work?: Insights from 43 Million Kilometers of European Cycling Data," directly addresses this dichotomy. Presented by Martin Lellep, Georg Balke, and Felix Waldner, the research delves into a massive dataset of Next Bike operations across Europe to uncover the underlying factors that contribute to a system's success or failure.
Key moments
- 0:00 Introduction and the core question of bike sharing success
- 2:00 The previous Marburg study and data acquisition
- 4:00 Overview of European data, scale, and seasonality
- 5:45 Accessing the public dataset and interactive demo
- 6:30 Massive scale comparison: Marburg vs. European data
- 7:00 Analysis of system types and e-bike prevalence in Europe
- 8:00 Hourly usage patterns: weekdays versus weekends
What Makes Bike-Sharing Work?: Insights from 43 Million Kilometers of European Cycling Data
Speakers: Martin Lellep, Georg Balke, Felix Waldner
Conference: 39C3
YouTube: https://www.youtube.com/watch?v=75GP4mRJP7A
Overview
Bike-sharing systems present a fascinating paradox: on one hand, images of neglected, broken, or discarded bikes are common; on the other, many cities see significant investment in and successful integration of these systems, often including electric variants. This talk, "What Makes Bike-Sharing Work?: Insights from 43 Million Kilometers of European Cycling Data," directly addresses this dichotomy. Presented by Martin Lellep, Georg Balke, and Felix Waldner, the research delves into a massive dataset of Next Bike operations across Europe to uncover the underlying factors that contribute to a system's success or failure.
The speakers, united by their passion for quantitative traffic analysis, demonstrate how an abundance of daily traffic data can be leveraged to enhance urban mobility and improve the lives of citizens. By moving beyond anecdotal observations, their work provides a robust, data-driven framework for understanding the complex interplay of societal, structural, and operational elements that dictate the effectiveness of bike-sharing programs. This analysis is crucial for city planners, public transport authorities, and bike-sharing operators seeking to optimize their services, ensure public funding is well-spent, and ultimately foster sustainable urban transportation.
The article will explore the meticulous data acquisition process, the advanced statistical modeling employed, and the key findings that shed light on what truly drives bike-sharing success. It will also highlight the practical tools and open-source resources provided by the researchers, empowering others to delve into their own urban mobility data. While the original prompt specifies "security conference talk," this article will adapt the "defensive implications" section to focus on actionable insights for improving bike-sharing systems, given the talk's content.
Background
▶ Watch: Introduction and the core question of bike sharing success (0:00)
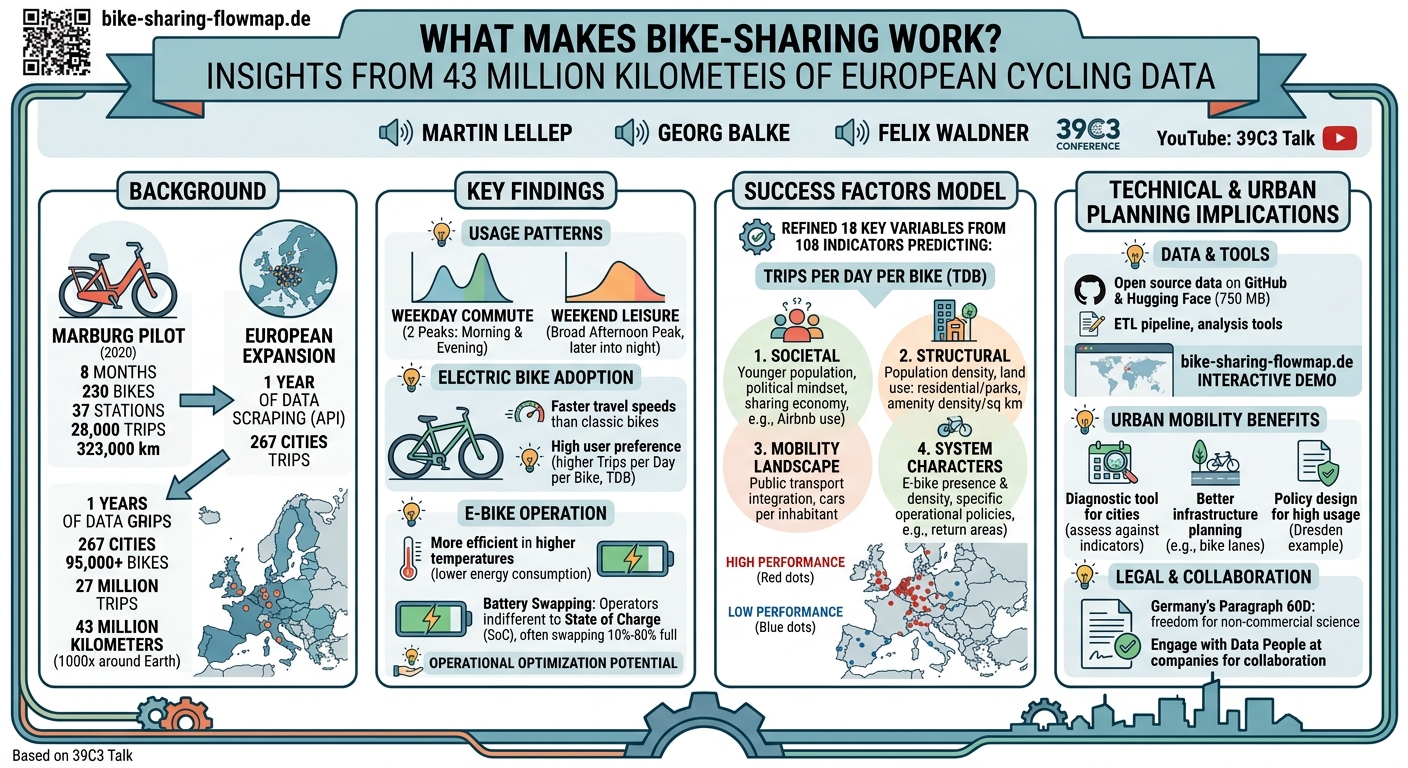
The genesis of this ambitious European study lies in a more localized project. Back in 2020, the speakers conducted an initial analysis of Next Bike data in Marburg, a university city in central Germany with a population of approximately 80,000. Over an eight-month period, they scraped data from 230 bikes distributed across 37 stations. The results were impressive: Marburg residents collectively traveled 323,000 kilometers over 28,000 bike trips. This initial success demonstrated the potential of quantitative traffic analysis to yield valuable insights into urban mobility patterns.
The data for the Marburg study, and subsequently the larger European project, was sourced from the Next Bike API. A crucial turning point occurred when urban researcher Uban Falai successfully reverse-engineered and reconstructed the API endpoint. Upon closer inspection, the researchers realized that this API did not exclusively serve Marburg data but provided information for all other European cities where Next Bike operated. This discovery served as the catalyst for expanding their analysis to a continental scale.
The European project represents a significant leap in scale and methodological rigor. Over the course of a year, the team meticulously scraped the Next Bike API every minute, accumulating an unprecedented volume of data. This expansive dataset now encompasses 267 cities, nearly 95,000 bikes, and a staggering 27 million trips, covering a total distance of 43 million kilometers – equivalent to over 1,000 circumnavigations of the Earth. The data revealed interesting patterns, such as fluctuations in available bikes across Europe, including a noticeable decline during winter months due to the temporary removal of all Next Bikes from the system in Poland. This comprehensive data collection and robust analysis form the bedrock of their findings on what truly makes bike-sharing systems thrive.
Key Findings
▶ Watch: Overview of European data, scale, and seasonality (4:00)
The extensive analysis of 43 million kilometers of European cycling data yielded several crucial insights into the operational characteristics and success factors of bike-sharing systems.
Firstly, a descriptive analysis revealed the prevalence of certain system types. Over 200 of the 267 cities featured free-floating or hybrid systems, allowing users the convenience of dropping off bikes anywhere, rather than being restricted to fixed stations. Equally surprising was the finding that nearly 200 systems already incorporated electric bikes (e-bikes), indicating a significant shift towards electrification in urban mobility solutions.
Usage patterns exhibited clear differences between weekdays and weekends. Weekdays showed a classic two-peak distribution, corresponding to morning and evening commutes. Weekends, conversely, displayed a broader, later afternoon peak, with increased activity extending into the night, suggesting more leisure-oriented usage. When comparing classic bicycles and e-bikes, while overall usage patterns were similar, e-bikes demonstrably facilitated faster travel, with average speeds consistently higher. Interestingly, average speeds were also lower on weekends across both bike types, reinforcing the notion of more relaxed, non-commuter rides.
A significant technical finding related to e-bike performance and battery management. The study correlated electric consumption with temperature and observed a counter-intuitive decline in energy consumption as temperatures rose. This is attributed to the physical property of internal resistance in batteries decreasing with increasing temperature, leading to greater efficiency. Regarding battery swapping, the data showed that most e-bikes received new batteries almost daily or every second to third day. However, operators appeared indifferent to the battery's State of Charge (SoC), often swapping batteries that were between 10% and 80% full. This suggests a potential area for operational optimization to reduce unnecessary rebalancing efforts.
To quantify system success, the researchers introduced Trips per Day per Bike (TDB) as a key performance indicator. From an operator's perspective, higher TDB correlates with increased revenue. From a societal standpoint, it signifies a well-integrated and useful system that citizens readily adopt. E-bikes consistently showed higher TDB values compared to classic bicycles, indicating a strong user preference for motorized assistance.
Mapping TDB across Europe, the researchers observed a striking disparity: a multitude of cities exhibited low usage (represented by blue dots), while only a select few achieved high performance (red dots). This distribution suggested that simple factors like geographic location or system size alone could not explain success. To delve deeper, they gathered an additional 108 indicators from diverse open data sources such as Eurostat (demographics), OpenStreetMap (mobility networks, bicycle lanes), Statista, and SRTM (for hilliness).
Through a sophisticated statistical model, these 108 indicators were ultimately refined to 18 key variables clustered into four groups that predict bike-sharing success:
- Societal Factors: Including the share of young people (more prone to sharing), political mindset (derived from election results), and inclination towards the sharing economy (e.g., Airbnb usage rates).
- Structural Factors: Such as population density, land use shares (residential, industrial, parks), and the density of amenities per square kilometer, indicating points of interest.
- Mobility Landscape: Encompassing the number of registered cars per inhabitant and the integration with public transport networks.
- Bike Sharing System Characteristics: Including the presence and density of e-bikes, and specific operational policies like return areas.
These clusters highlight the multifaceted nature of bike-sharing success, demonstrating that it is not a singular factor but a complex interaction of urban environment, social behavior, and system design.
Technical Deep Dive
▶ Watch: Accessing the public dataset and interactive demo (5:45)
The technical foundation of this research lies in its meticulous data acquisition and sophisticated statistical modeling. The primary data source was the Next Bike API, which serves information to the company's Android and iOS applications. The researchers developed a custom scraping tool to query this API every minute for an entire year. This constant polling allowed them to capture dynamic information about each bike, including its exact location, technical parameters (e.g., whether it's electric), State of Charge (SoC) for e-bikes, and crucially, its unique ID. By tracking these IDs over time, the system could infer individual trips.
The process of trip inference involved observing when a bike "disappeared" from its last known location (indicating it was reserved or rented) and when it "reappeared" at a new location (signifying its return, either to a station or a free-floating drop-off point). This method allowed the creation of a comprehensive trips table, detailing origins and destinations. However, the researchers openly acknowledged two major limitations of this approach:
- No actual route information: The API only provided start and end points, not the path taken. Route imputation would require external routing algorithms.
- Inability to detect round trips: If a bike was returned to its exact origin point, it would not register as a distinct trip in their dataset. This is particularly relevant for specific use cases like cargo bikes (often requiring return to the same station) or touristic bike-sharing schemes (where bikes are rented for exploration and returned to the same or a limited number of stations).
Beyond individual trips, the data also revealed large-scale bike relocation. An interesting anecdote involved bikes from Marburg appearing in Cyprus years later, suggesting operational reasons for moving fleets across significant distances. The analysis identified 17 disconnected graphs of cities where bikes were moved for at least 10 trips between urban centers, indicating either user-driven inter-city travel or, more likely, large-scale operational rebalancing due to fluctuating demand or technical overhauls. This presents a fascinating "rabbit hole" for further data science investigation.
The core of the performance analysis was a statistical model designed to identify predictors of high Trips per Day per Bike (TDB). This involved a multi-stage process:
- Pre-processing:
- Logarithmic transformation: Applied to certain variables to linearize their correlation with TDB, improving the model's ability to capture relationships.
- Multicollinearity control: This step involved identifying and removing redundant variables. If two or more variables conveyed essentially the same information, only one was retained to prevent deterioration of model quality and ensure independent contributions.
- Model Setup: An Ordinary Least Squares (OLS) model was employed. This is a linear regression model that sums up the contributions of various independent variables, each weighted by a coefficient, to predict the dependent variable (TDB).
- Variable Selection: A bidirectional stepwise regression technique was used. This iterative process involved systematically adding or removing one variable at a time, re-fitting the OLS model, and computing the Akaike Information Criterion (AIC). AIC is a measure of the relative quality of statistical models for a given set of data, penalizing models with more parameters to prevent overfitting. The process continued until the model with the optimal AIC score was achieved, resulting in a refined set of 18 key variables from the initial 108.
These 18 variables were then clustered into the four groups discussed earlier (Societal, Structural, Mobility Landscape, Bike Sharing System Characteristics), providing a comprehensive and statistically validated understanding of the factors influencing bike-sharing success. The entire methodology and the resulting data are made available as an open-source paper and dataset, promoting transparency and reproducibility within the scientific community.
Demo / Proof of Concept
▶ Watch: Analysis of system types and e-bike prevalence in Europe (7:00)
To make their extensive research accessible to a wider audience, the speakers provided both raw data and an interactive demonstration tool. The full dataset, comprising approximately 750 megabytes of information, is openly available on GitHub and Hugging Face. Users can download it with just two lines of Python code, enabling them to explore their own city's data, build applications, or conduct further research. The ETL (Extract, Transform, Load) pipeline used to process the data is also available on GitHub, allowing full transparency and reproducibility of their analytical steps.
For those preferring an interactive approach over direct data manipulation, the researchers developed bike-sharing-flowmap.de. This web-based tool allows users to explore all 267 surveyed cities, visualize their TDB (Trips per Day per Bike) performance, and crucially, load specific trip data to observe bike-sharing flows within a chosen city. The live demonstration showcased how the map interactively aggregates and displays these flows, highlighting heavily frequented areas, less used zones, and any asymmetries in bike movement.
A compelling example presented was Dresden, which boasts the highest TDB in Germany at 5.7 rentals per day per bike. The interactive map visually confirmed Dresden's high usage. The researchers explained that factors from their OLS model contribute to this success: Dresden is a university city, generally younger than the German average (aligning with the "young people" societal factor), and has a high density of bikes, ensuring availability. Beyond the model's general factors, local domain knowledge further illuminated Dresden's success. The city employs a strict return area policy, wherein bikes must be returned to virtual stations, along major highways, or for a small fee, in residential areas. This policy encourages bikes to aggregate at key transportation hubs, making them reliably available where demand is highest, such as the Dresden Neustadt station. Furthermore, Dresden's dense public transit network and strong integration with the Next Bike system significantly contribute to its high performance, as bike-sharing often acts as a feeder service for public transport. These demonstrations underscore the practical utility of their data and models for urban planners and operators.
Implications for Urban Mobility and System Optimization
▶ Watch: Hourly usage patterns: weekdays versus weekends (8:00)
While this talk was not about cybersecurity, its findings have profound implications for the design, operation, and policy-making surrounding urban bike-sharing systems. Rather than "defensive implications" in a traditional security sense, this section outlines actionable insights for improving the efficacy, sustainability, and public utility of these vital urban mobility solutions.
Firstly, the identification of the four clustered groups of success factors – Societal Factors, Structural Factors, Mobility Landscape, and Bike Sharing System Characteristics – provides a powerful diagnostic tool for cities and operators. Cities can assess their current performance against these indicators to understand why their system might be underperforming. For instance, a city with a low share of young people or a less developed sharing economy culture might need to tailor its marketing or incentive schemes differently. High population density, numerous amenities, and a well-integrated public transport network are strong predictors of success, suggesting that bike-sharing thrives as part of a comprehensive, multimodal transport strategy.
From an operational standpoint, the insights into e-bike battery management offer a clear path to optimization. The observation that batteries are often swapped regardless of their State of Charge (SoC) (between 10% and 80%) points to an inefficiency. By implementing more intelligent rebalancing and battery-swapping algorithms that prioritize truly low-charge batteries, operators could significantly reduce operational costs, extend battery life, and minimize the environmental impact of unnecessary vehicle movements for rebalancing. The detection of large-scale bike rebalancing (like the Marburg-to-Cyprus example) also highlights the importance of understanding and optimizing fleet distribution at both local and regional levels to meet fluctuating demand.
The research encourages a data-driven approach to urban planning. By collecting and analyzing mobility data, cities can make informed decisions about infrastructure investment (e.g., bike lanes), integration with public transport, and the design of return policies. The Dresden example, with its strict return area policy leading to reliable bike availability at key hubs, demonstrates how thoughtful policy can directly translate into higher usage and public satisfaction.
Finally, the speakers shared valuable insights regarding the legal aspects of data collection and sharing for scientific research. They highlighted Germany's Paragraph 60D, which grants significant freedom for non-commercial, non-profit scientific data mining. Crucially, a recent decision in Hamburg confirmed that the intention to make a dataset openly available is sufficient to be considered scientific research. Their personal experience, involving initial difficulties with university legal departments but successful direct engagement with Next Bike, underscores the importance of finding the "right people" – typically data enthusiasts within companies, rather than press departments – to foster collaboration and potentially gain access to even richer datasets. This advice is invaluable for researchers and civic hackers looking to contribute to urban mobility improvements.
Ultimately, the goal of this research and its implications is to move towards a future where fewer bikes are abandoned in rivers and more are actively used, contributing to sustainable, efficient, and enjoyable urban transportation.
Key Takeaways
- Data-Driven Insights are Crucial: Quantitative analysis of extensive mobility data provides objective insights into the complex factors driving bike-sharing success, moving beyond anecdotal observations.
- E-bikes Boost Usage: Electric bikes consistently show higher "Trips per Day per Bike" (TDB) and are preferred by users, making electrification a key factor for system performance.
- Success is Multifaceted: Bike-sharing performance is determined by a complex interplay of societal factors (e.g., young population, sharing economy inclination), structural urban characteristics (e.g., density, amenities), the existing mobility landscape (e.g., public transport integration), and specific system design choices (e.g., bike density, return policies).
- Operational Optimization Potential: Significant opportunities exist to improve operational efficiency, particularly in e-bike battery swapping strategies, by prioritizing truly empty batteries rather than swapping based on indifference to State of Charge.
- Open Data Fosters Progress: Making large-scale mobility datasets and analytical tools openly available empowers researchers, developers, and cities to conduct further analysis, build applications, and contribute to better urban planning.
- Engage with Data Owners: For researchers, direct communication with the "data people" at mobility providers can be more effective than navigating legal departments, often leading to productive collaborations.
About the Speaker(s)
The talk was presented by Martin Lellep, Georg Balke, and Felix Waldner. While their specific titles and affiliations beyond their association with the 39C3 conference are not detailed in the transcript, they describe themselves as individuals who "do very different things all kind of related to data." What unites them is a shared "love for quantitative traffic analysis," which is the driving force behind their extensive research into bike-sharing systems. Felix Waldner was specifically introduced as the "data analysis expert," leading the detailed explanation of the statistical models and findings. Their collective expertise in data science and urban mobility research allowed them to undertake this large-scale project, transforming raw data into actionable insights for the future of urban transportation.
All talks from 39th Chaos Communication Congress (39C3): Power Cycles